
Blackfire is a data-aggregation platform for analysts to observe and report the performance of digital marketing campaigns across platforms. Users can generate views, tables, and charts to visualize data pulled from multiple networks.
GeistM's Blackfire, a proprietary tool, intended to evolve into a SaaS platform for their clients, but they faced low engagement, as users preferred alternative services to complete their daily tasks, leading to a lack of interest in the product.
We holistically addressed the project, encompassing UX research through hand-off, forming a comprehensive product roadmap, enhancing the user experience for new onboards and experts, and reducing friction across the product's features.
We observed increased retention rates by 8% and shaved minutes off time on task, saving our data analysts time and improving team-wide efficiency, and launched with our largest client, HelloFresh.

Research
Blackfire was underutilized. To investigate why, we spoke with our early users and studied our competitors to break down the problem.
During its early beta stage, internal data analysts were asked to incorporate Blackfire into their daily tasks. After running some surveys and reviewing our analytics, the team realized adoption was very slow.
To gain insights into both the usage of our platform and the effectiveness of our onboarding experience, we conducted usability audits on two user groups:
Group 1: 8 early adopters demonstrated their platform usage for generating views and reporting ad campaign success.
Group 2: 8 new hires were asked to perform the same tasks as Group 1, without any prior experience with the platform.
We mapped out their experiences to identify commonalities in thought patterns and pain points.

Complex view builder
Users encountered several challenges with the View page, including losing unsaved work, navigating across larger tables, and managing variables.
More compatibility with competing platforms
Participants preferred other services to complete tasks like date comparison and report generation.
Random lost work
Users lost progress after forgetting to save or accidentally leaving the page while navigating data tables with trackpads.
Improved View Editor and addition of reporting features
Improve editing capabilities for a more efficient flow, and include more localized controls so users can work more quickly.
Addition of templated reports and a date comparison tool
Add features that are compatible with users' daily tasks to keep them on our platform.
Auto-save & "Edit Mode"
Auto-save could prevent users from losing progress and edit-mode for making temporary changes.
Challenge #1
The most significant and troublesome task for our users was to build and generate views, typically consisting of a chart and a table visualizing campaign performance.
Users encountered several challenges with the View page, including:
Misunderstanding feature functionality or UI language
Horizontal scrolling in large tables, leading to accidental duplications or deletions
Difficulty managing graph metrics and dragging columns across extensive tables
Inadvertently leaving the page and losing changes with trackpad swipes
Lack of indication for filtered or sorted columns
Frustration and mouse fatigue from switching between table and view editor

We aimed to simplify the user flow by localizing editing functionalities, adding a feedback system for actions, and removing the need to save manually.

To make editing more accessible, we added a list view of columns to the sidebar editor, enabling users to easily edit, add, delete, and filter columns without navigating the entire screen and enabling them to keep track of their modifications.

We introduced a filter icon as a visual aid to indicate applied filters.

We implemented a notification system with an "Undo" option, providing a safety net for user error or experimentation.

We implemented a notification system with an "Undo" option, providing a safety net for user error or experimentation.
Challenge #2
Users would leave Blackfire when they needed to compare performance over specific date ranges or to generate specific reports.
Blackfire had many functionalities, but users preferred the familiarity of external tools, including Meta, Outbrain, Taboola, Tableau, and Datarama. We had users record themselves using these products so we could observe their natural flow and understand more about the tasks they needed to perform.
Too much effort was required to set up custom views when generating routine reports like LP Split Tests and Order ID.

We generated a menu of standard reports so our users could quickly generate and export what they needed.

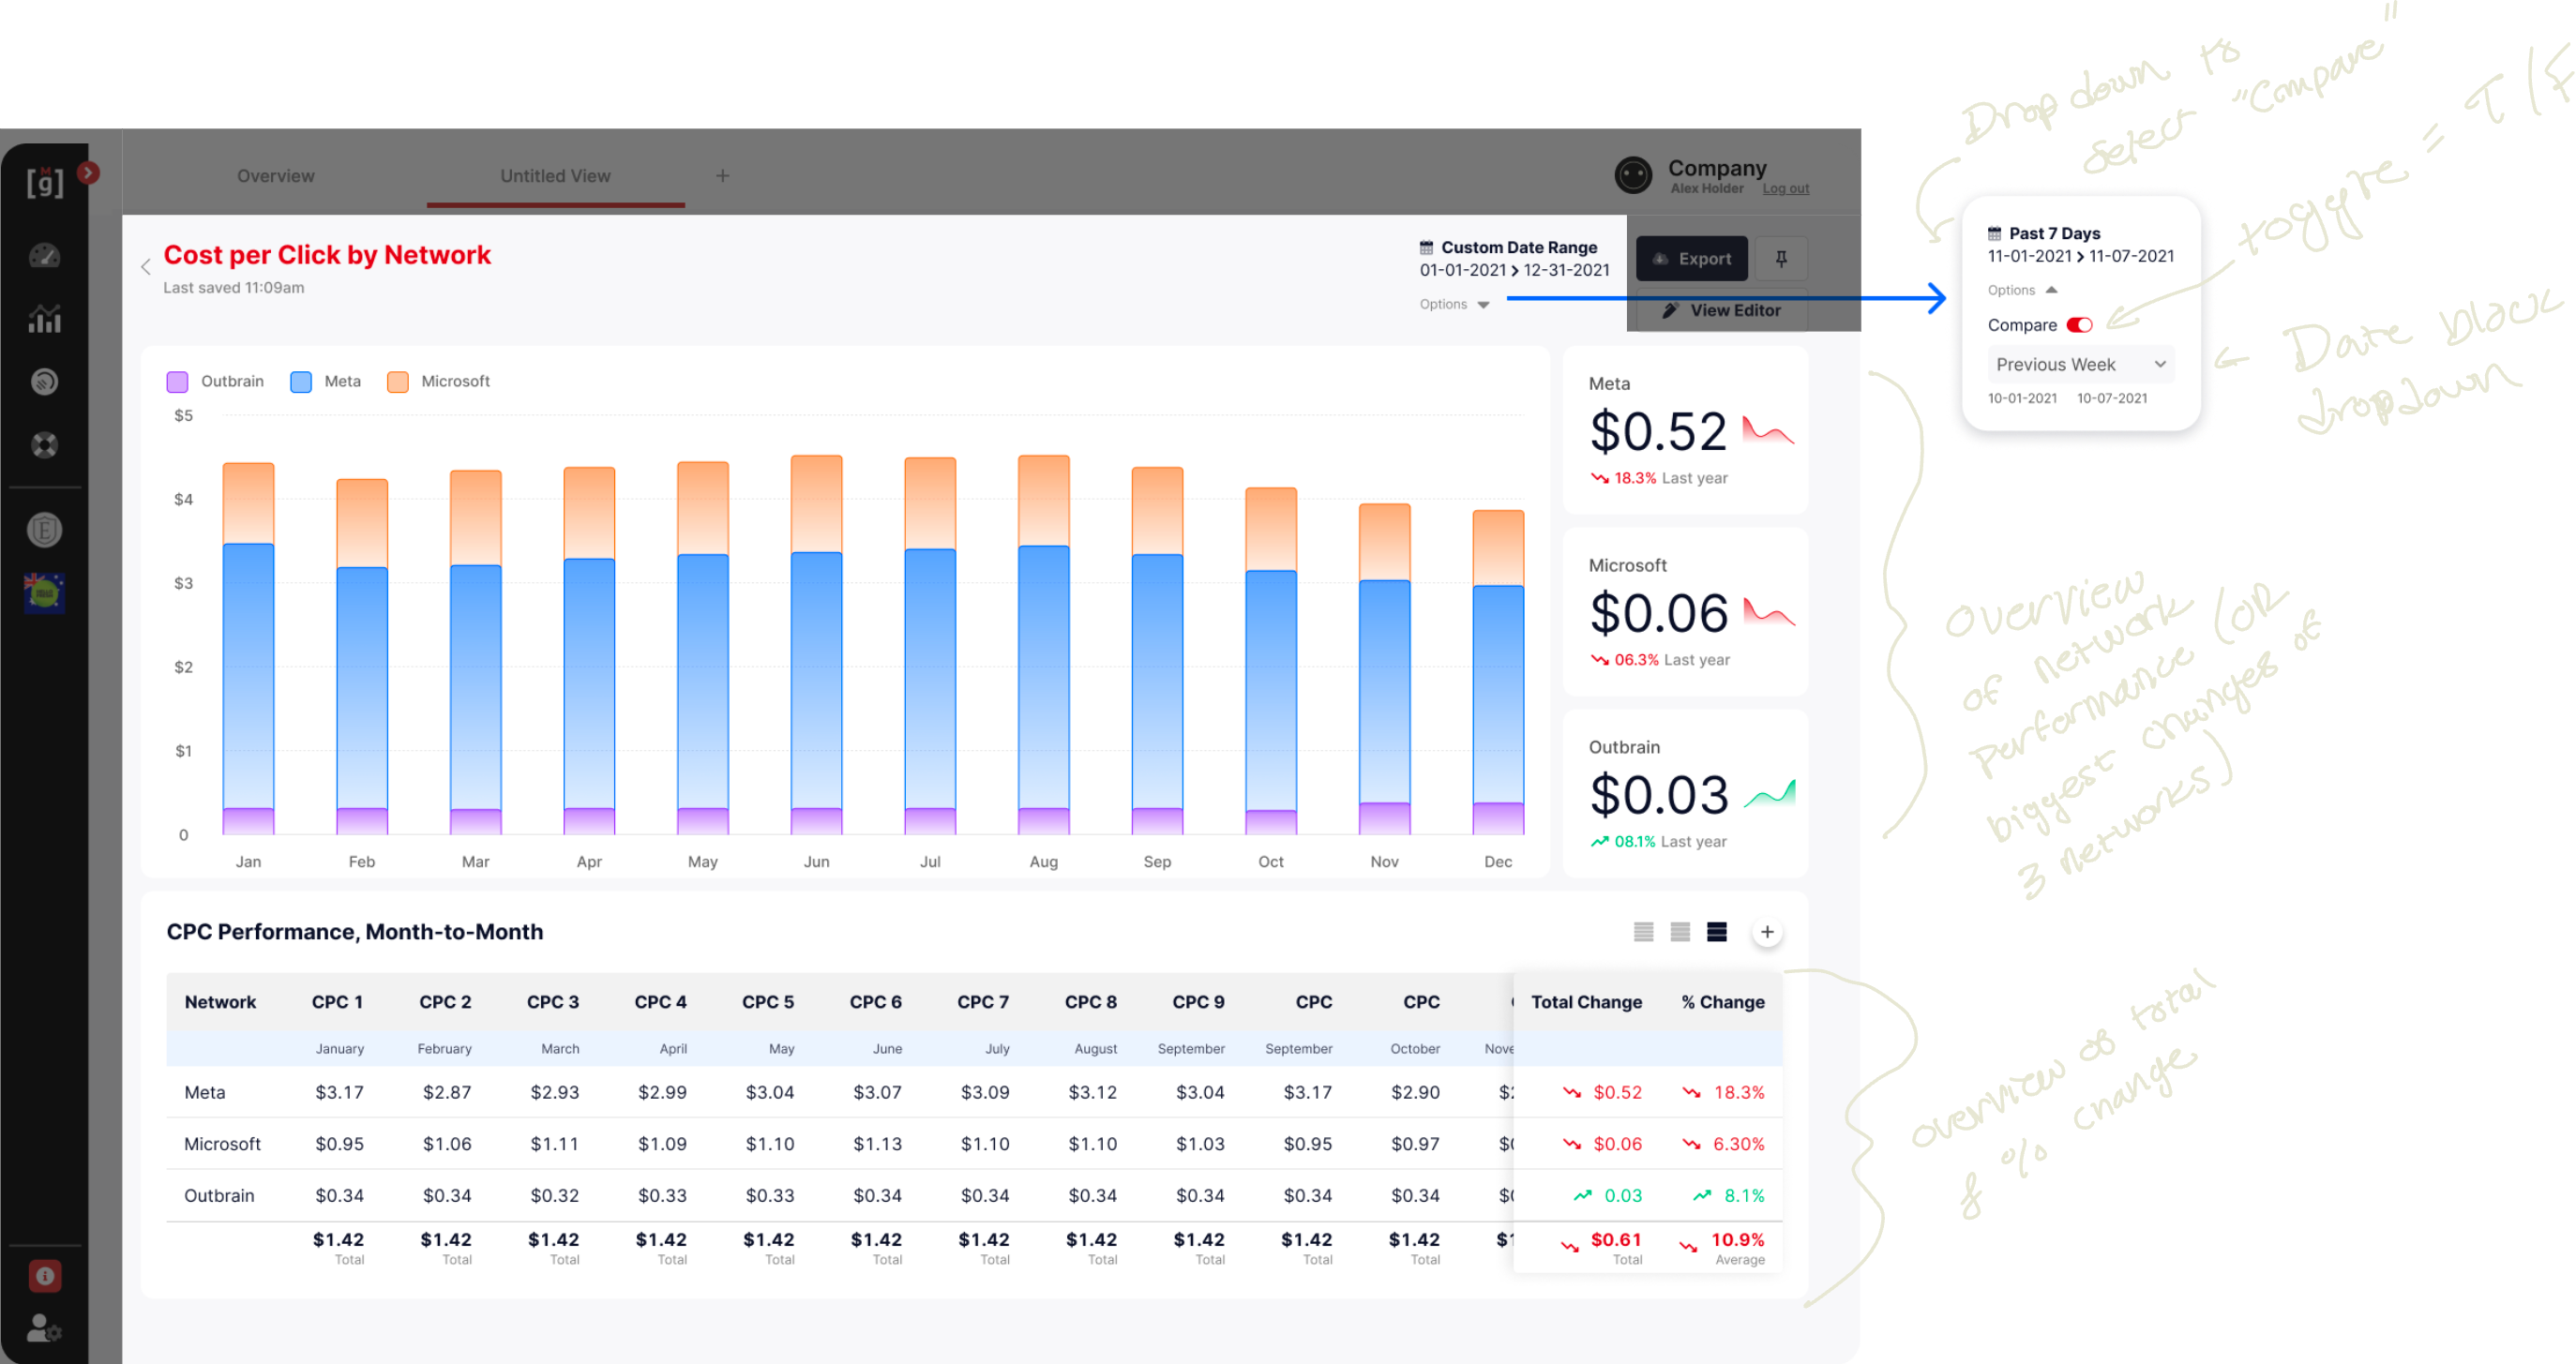
To help users compare performance over various date ranges, we created a Date Comparison tool.
Toggling on "Comparison" would enable users to select a date range to compare a specific variable, such as Cost Per Click over the last X amount of days or weeks.
Challenge #3
Blackfire's data was pulled from multiple sources, so page load times took longer than users expected. They also didn't know whether the page was finished loading or the page failed.
We designed more informative load states that would indicate progress and page errors.


Outcome
We implemented a vast amount of change under a tight turnaround time and saw a small boost in engagement.
While minor iterations were to be made after release, we observed increased engagement rates by 8%. Users reported shaved time off time on task, and we saw fewer errors reported in our Slack channel.
Because we ambitiously tackled a lot of change at once, there were some growing pains.
We presented the changes to our company and created a Slack channel for support following the new release, but over time recognized a need to establish onboarding protocols and walk-throughs.
